Blubrry is dedicated to offering the most comprehensive podcast stats around, but we realize that some podcasters may be confused by what seems like information overload. This post will help you make the most of our robust reporting, whether your goal is to attract advertisers, track growth, or spot trends. Here’s a close look at each of the reports you can pull in Blubrry stats, what data each report delivers, and how you can use that information.
History
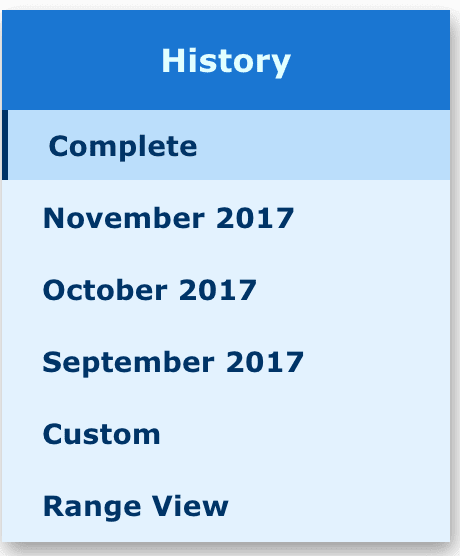
At the upper left of your Blubrry stats page, you’ll see a History section. Here are the various ways you can view this information:
- Complete: This is the global picture of what has happened to your show over its life.
- Monthly: a snapshot of all media consumption on all episodes that have been downloaded or played over the month in question. If an episode gets zero downloads in the reporting month, it will not show up in the report.
- Range View: Just like it sounds, the range view allows you to choose a specific range of dates. “I find range view useful when looking at advertising reporting,” says Blubrry CEO Todd Cochrane. “I can pull the data for specific episodes over a defined period. It’s also handy to look at performance over specific periods of time.”
Reports:

The Reports section is where the data can get really granular, and may seem the most confusing. Here’s a rundown of each report and what it can tell you:
- Trending is the day to day trend line. You can look at how your show trends in a global view of the entire show or you can look more closely at a specific month or episode. The reporting tool also allows you to get very granular, looking at how a specific episode has performed over its entire lifetime.”I rely on the trending line a lot,” says Cochrane. “I look for yearly, monthly and weekly trends. The trending report tells me over time if I am on the right track – if I see a dip, I know that I need to examine the show and see why. Was it due to a holiday, did I miss an episode, was I off my A game? The trending line for me also allows me to give advertisers an running average for the show month to month. I can pull the report and show them that I have had x number of listeners each month for y number of months. This build trust with the media buyer.”
- Distribution details how your show is being consumed across categories like web browsers, podcatchers, mobile apps, and so on. This is a quick look at how your audience is accessing your podcast, and can again be detailed down to the specific episode.
- Platforms then breaks the distribution down by Windows, Apple, Linux, iOS, Andorid, piecing out the data so you can see how the podcast is being consumed. Each of these pieces allow you to get a close-up snapshot of what’s happening, and may help you identify and engage with small sectors of your audience. “On my own show I give a shoutout to the Blackberry users that are listening,” says Cochrane. “While they are a small minority, this lets them know I know they are out there.”
- Clients is a deep dive into how your podcast is being consumed. If, for example, you wanted to know how many listeners are using the iPodder desktop application, or PocketCast mobile app, this report will give you that information. With over 160 clients currently being reported on, this is a rich field of data just ready to be mined. “We give the podcaster the ability to see exactly how the show was accessed,” explains Cochrane. “It’s a good way to measure growing numbers of Android subscribers and where to focus messaging in the show and on social to attract segments of listeners that have not yet subscribed.”
- Geography simply shows you where your audience is listening, and Blubrry’s regional reporting continues to become more specific and robust. Using this data, you can acknowledge larger sections of your audience or plan live events in areas where you know listeners congregate. Or, you can use the information to make listeners in less-represented places feel special. “On my show I have a huge contingent of listeners in Texas,” Cochrane says. “So I will give a shoutout to Texas or the lone listener down in Antartica. It allows me to understand how global my audience really is and keeps me grounded in remembering that some of my listeners may be expats or use English as a second language.”
- Refers and Domains deliver insights on where traffic to your show is coming from. “I often get linked to by third parties. I can actually see how many listeners those referral links drove to my show,” explains Cochrane.
Sounds like a lot? It is, but remember that these reports are designed to be flexible, so you can use them as you need them. “Each of the reports we provide are like an onion: you can look at outside of the onion, or start peeling off layers all the way to the core. We wanted to make it easy for podcasters to determine where improvements could be made in their shows by looking all the way down to to the episode level.”
Remember, some of the above reporting is only available to Blubrry Standard Stats users. For just $5/month, you can have access to top-of-the-line stats to help you better understand your audience, monitor the growth and health of your show, and deliver the best possible information to potential advertisers.