


Two New Data Points for Podcasters
We are excited about this release with a change to our monthly trending chart for all stats users and a brand new metric.
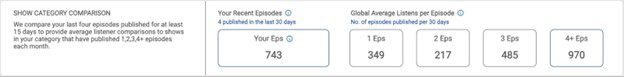
Primary category comparison of your show to other shows in your category. (Thrive Feature)
As a podcaster, staying on top of your metrics is crucial for understanding your audience and growing your show. That’s why we’re constantly working to improve our data and provide you with valuable insights. In this latest update, we have two new data points that will give you even more information about how your podcast is performing.
The first change is to our monthly trending chart for all stats users. This chart shows the overall trends of your show’s downloads and plays over the past month. With this update, we have also added a comparison feature that allows you to see how your show stacks up against other podcasts in the same category.
This new metric, known as the “Primary Category Comparison,” gives you a better understanding of where your show stands in
This new data metric compares your show performance against other shows in the same podcast category. We will compare your primary category set in show settings to other shows Blubrry measures in the same category. Satisfy your curiosity! Make insightful decisions for your show based on this new information and reach your full potential.
Commitment to Clarity Monthly Trend Chart Update (All Stats Users)
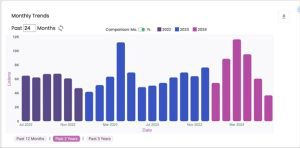 You asked us for more details in the trend chart, and we have re-designed it to give you more clarity, allowing you to see how your show has progressed over time
- Podcasters can now go back any number of months up to 36, whereas before, they could only do 12, 24, or 36 (we always offered three years back, but you are now not limited to full-year amounts)
- Podcasters can now toggle the monthly chart between a chronological view and a month-by-month comparison
We strive to offer detailed insights into your show performance and your understanding of your overall reach. Based on your request, we aim to give you the best overall picture possible that we can provide.
Utility of the Dashboard
This is a reminder that our stats dashboard contains multitudes of information about your podcast and is a potent tool for giving you actionable information. By leveraging this data correctly, you can make informed decisions to enhance your show, optimize marketing tactics, and make a podcast with purpose.
The new trend chart is available to all podcast stats customers, and the category comparison is available to all thrive customers. Those who want these new metrics can order Thrive as an add-on under Manage Subscriptions in the podcaster dashboard. Learn more about the Thrive Bundle here.