 Blubrry Podcasting has introduced the most significant stats update in its history to the Blubrry Statistics platform with new features. The goal from the beginning has been to enhance the podcaster’s insights to analyze show growth and listener retention.
This statistics update is the first of many updates we have planned for the Podcast Statistics system with new features to be introduced over the coming months. We have provided accurate statistics since 2007 and led the way in setting the current measurement standards.
The Blubrry team has revolutionized podcast stats to improve user experiences, provide robust analytical tools – such as better graphs, charts, tables – and insights that are more advanced.
What’s new?
- Listenership trends
- Retention data
- Impactful Play data
- Updated charts and graphs
- Simplified data
Data is displayed in four main categories:
- Retention
- Trends
- Geolocation
- Apps and Devices
Listenership Trends: With insights such as total listens, number of listens today and number of listens in the past 30 days, podcasters can examine their show performance and gain an instant insight of listenership.

Navigation has been simplified, along with the ability to set date ranges quickly with the same view of data down to the episode level viewed at your preference.


Retention Data
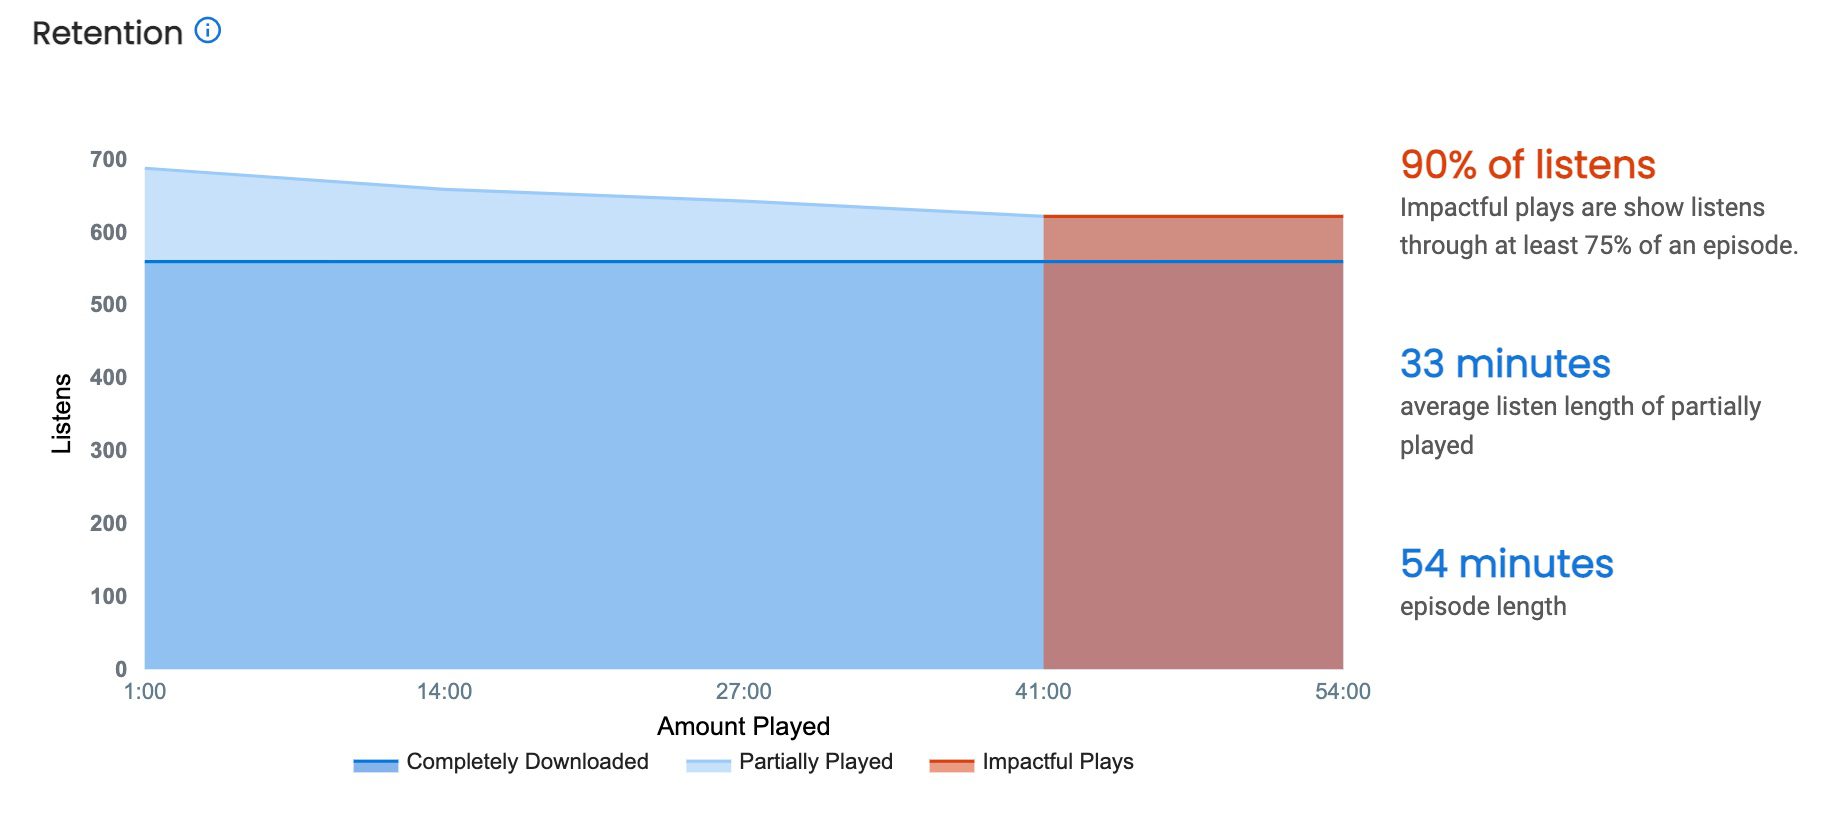
This retention chart is one of the most exciting innovations we have developed. If you want to know whether listeners are sticking around for your whole episode or just part of it, you will love this new chart.
The chart includes:
Impactful Plays: Is defined from a significant portion (75% to 100%) of the episode that was downloaded or played.
Average Listen Length: This is derived from the average listen length of partially played content.
Completely Downloaded: An excellent representation fully delivered media files and insight into the total number of followers or subscribers your show/episodes have.
Trends
Trends are exciting, as you can see summaries of this data that can be organized to be looked at in the following top-level for your show, episode level or even a specific range of time. You will see how many listens there are over time – from 30 days to 2 years – and track your podcast growth on a daily or monthly basis.
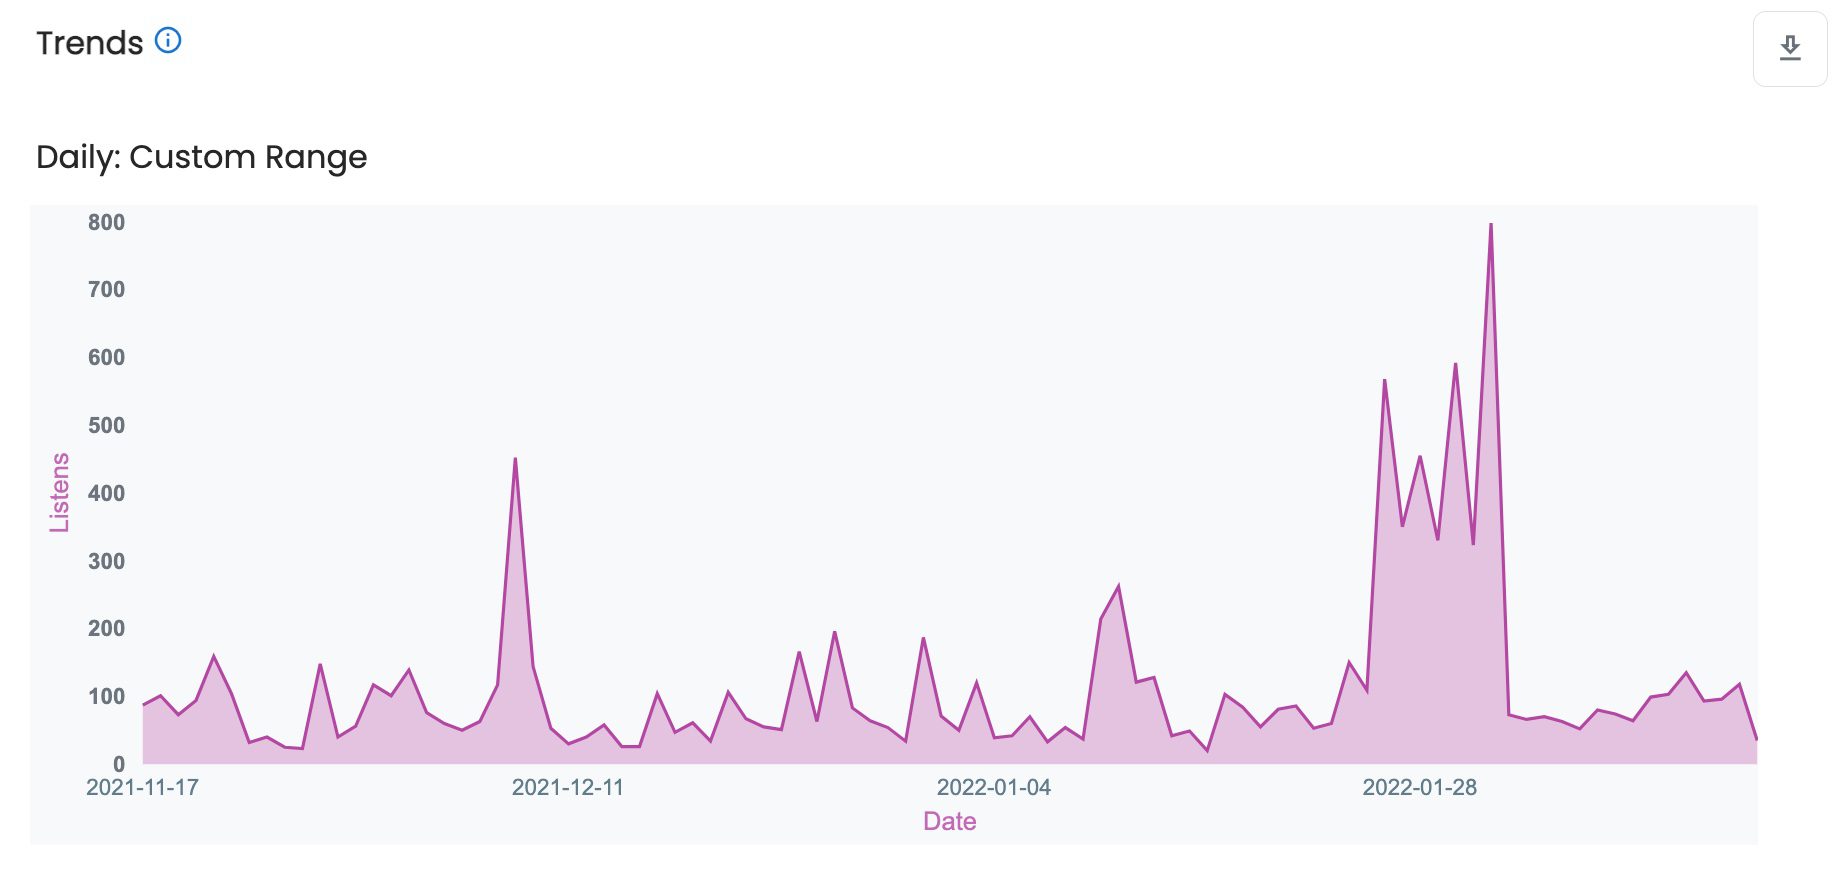
At the episode level, you can even narrow your view to hourly for the first seven days an episode has been published.
On a specific day or time of the year, you might notice that your podcast gains many downloads. So it’s a good idea to know when and why the show is doing well to find winning strategies in growing your show.
Geolocation
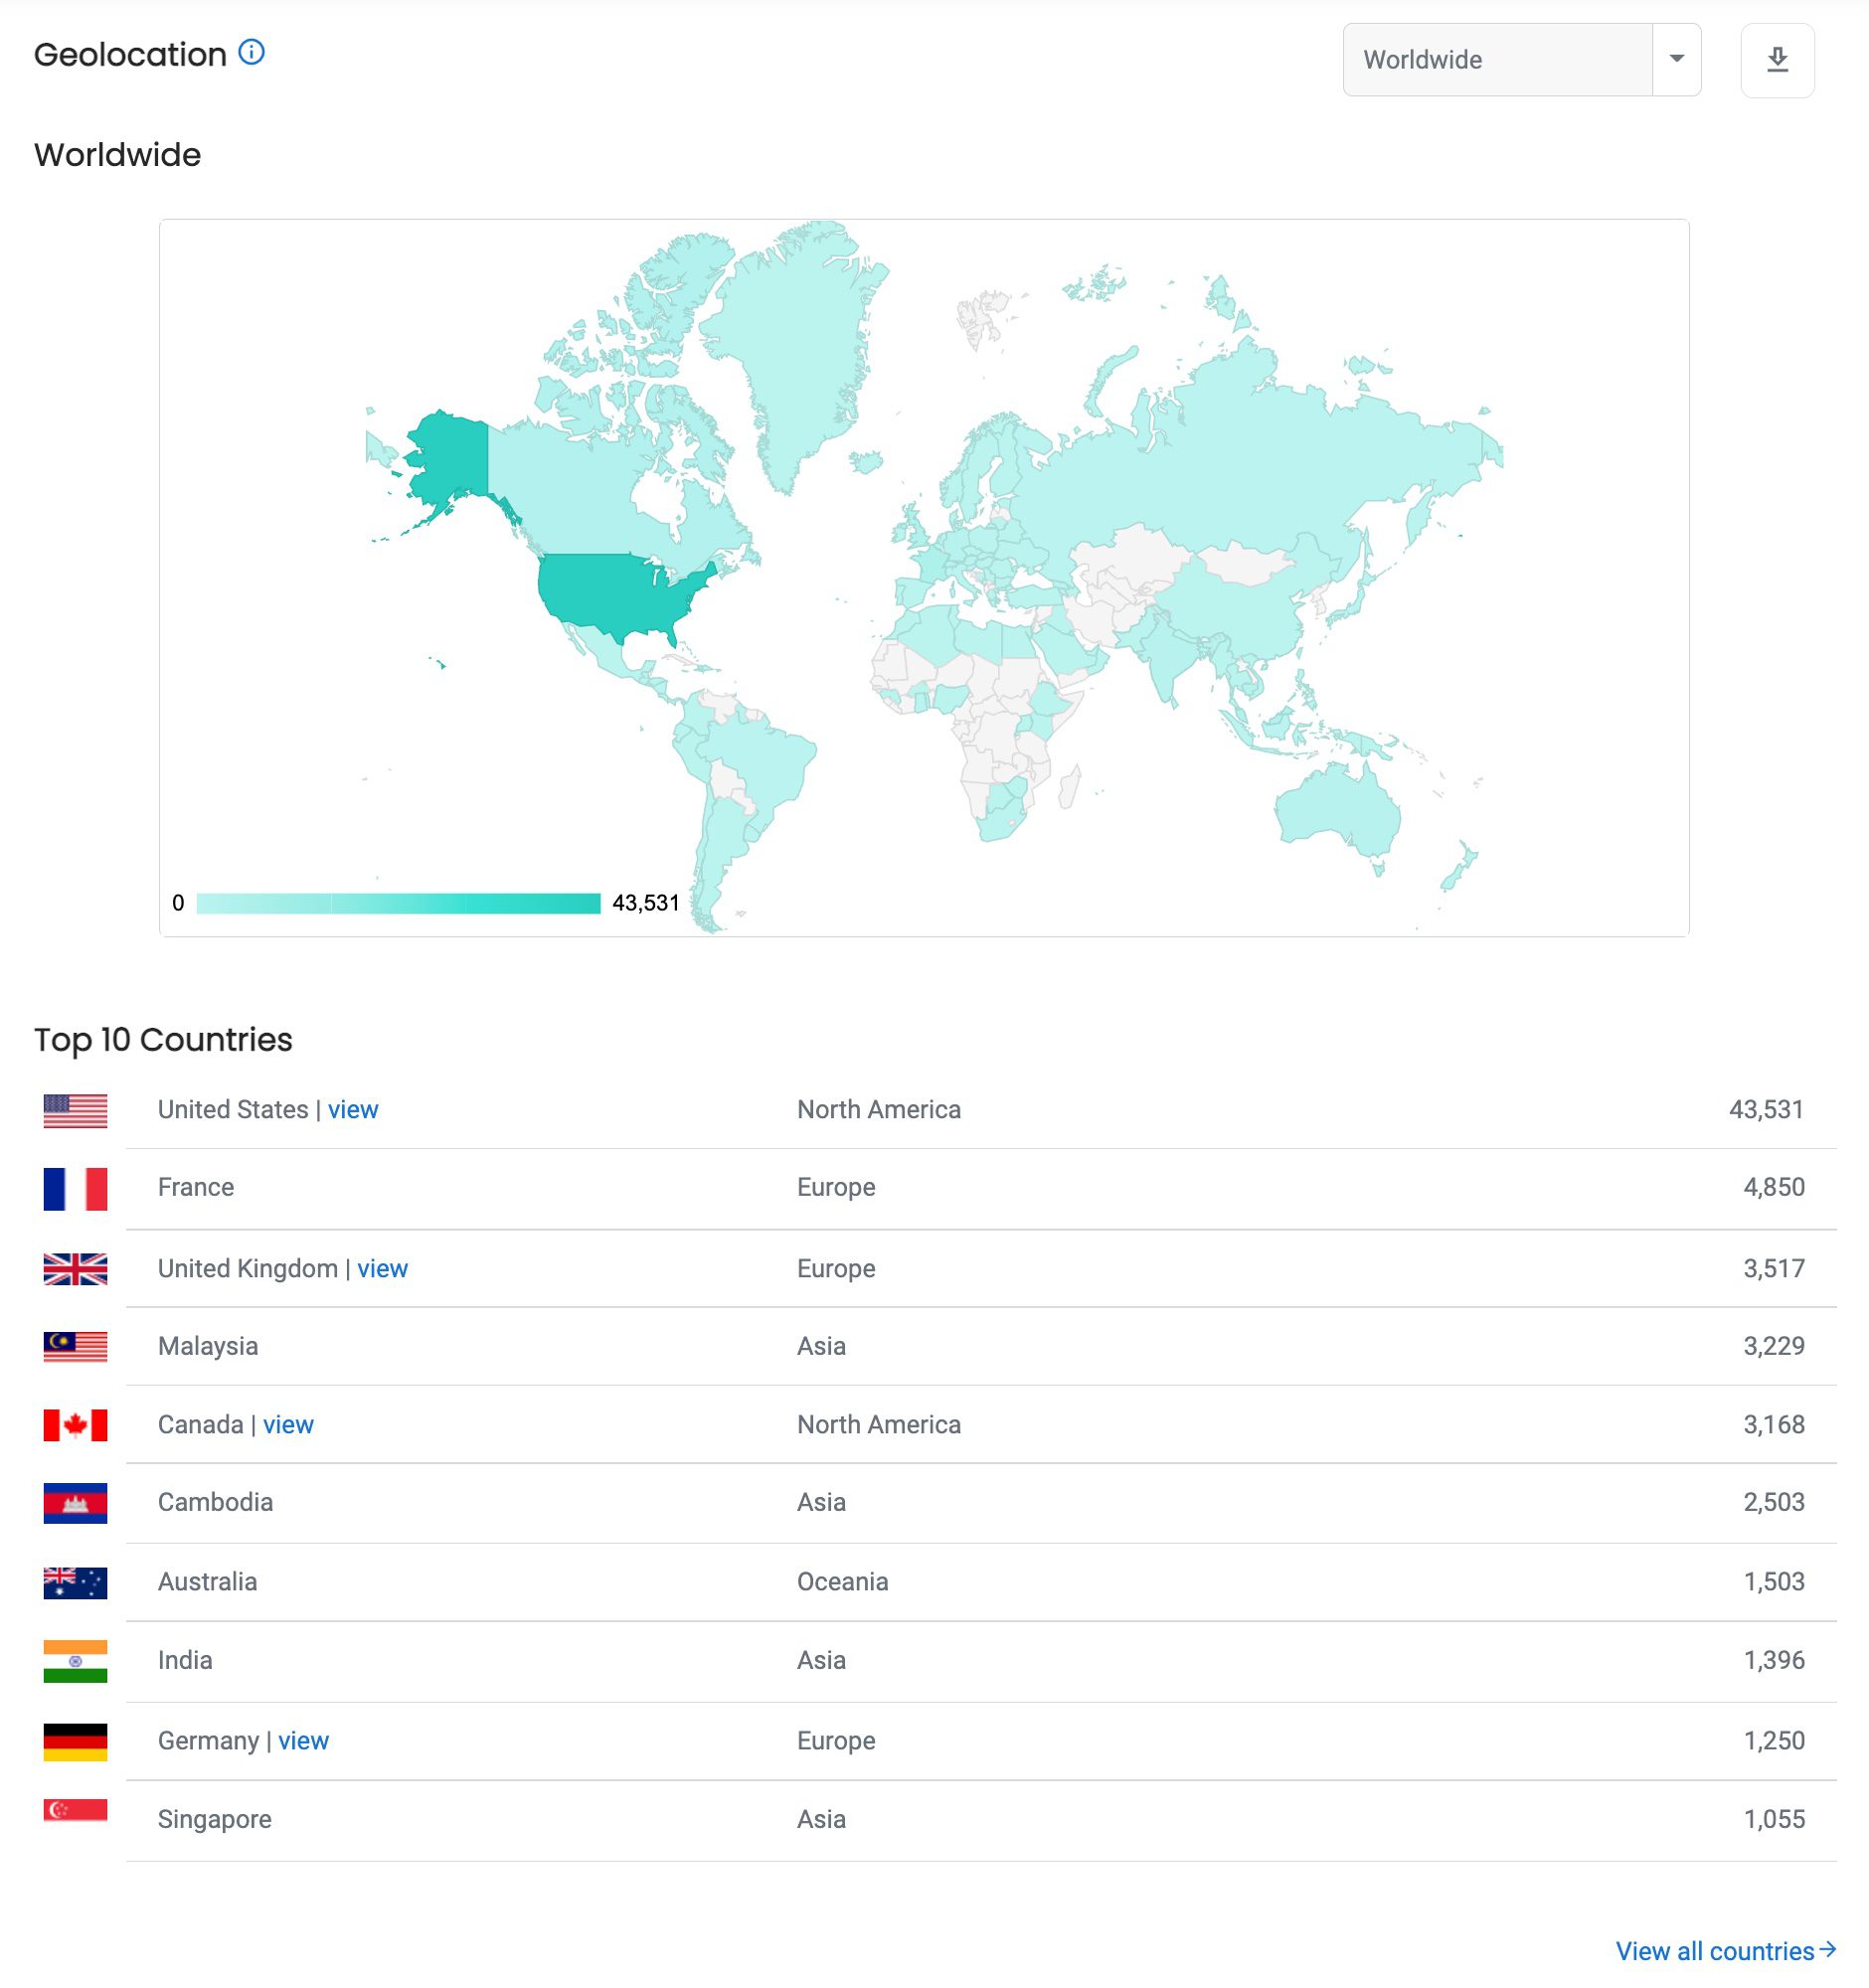
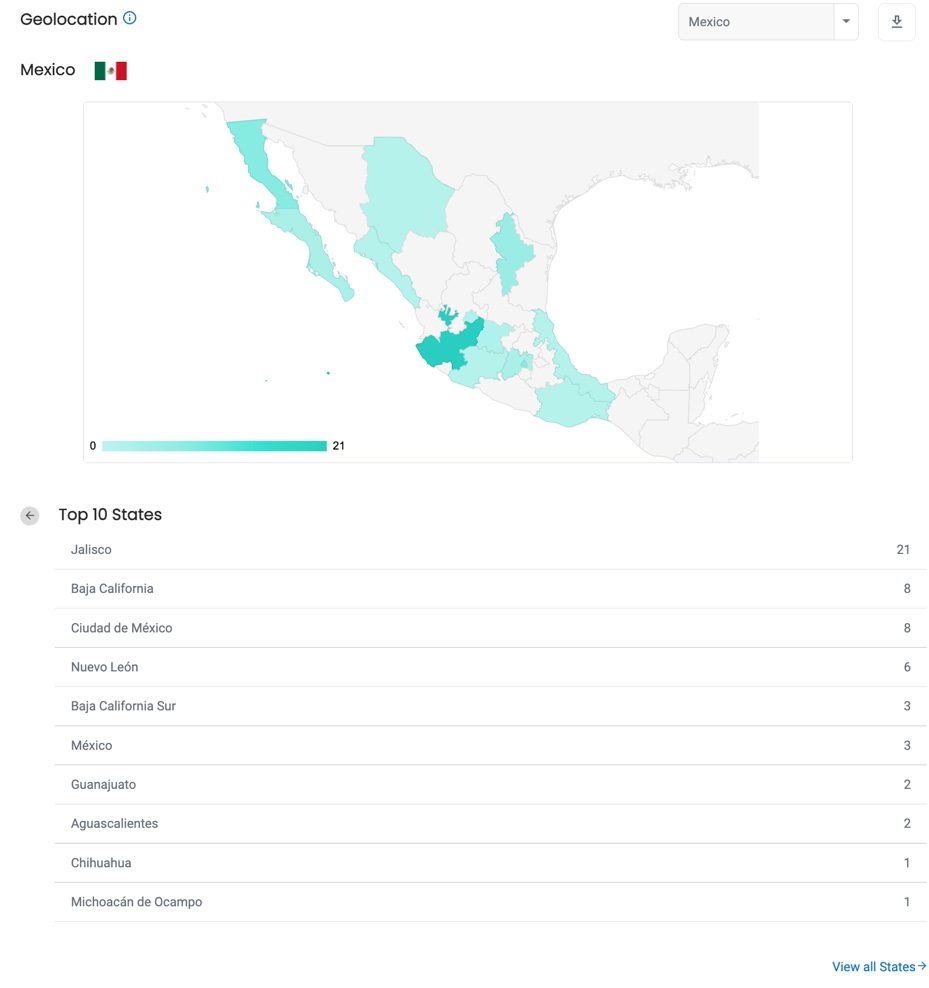
Geolocation allows users to track where their audience is listening from. For countries such as the United States, Canada or Mexico, data will also be broken down into smaller regions, states and provinces.

 Apps and Devices
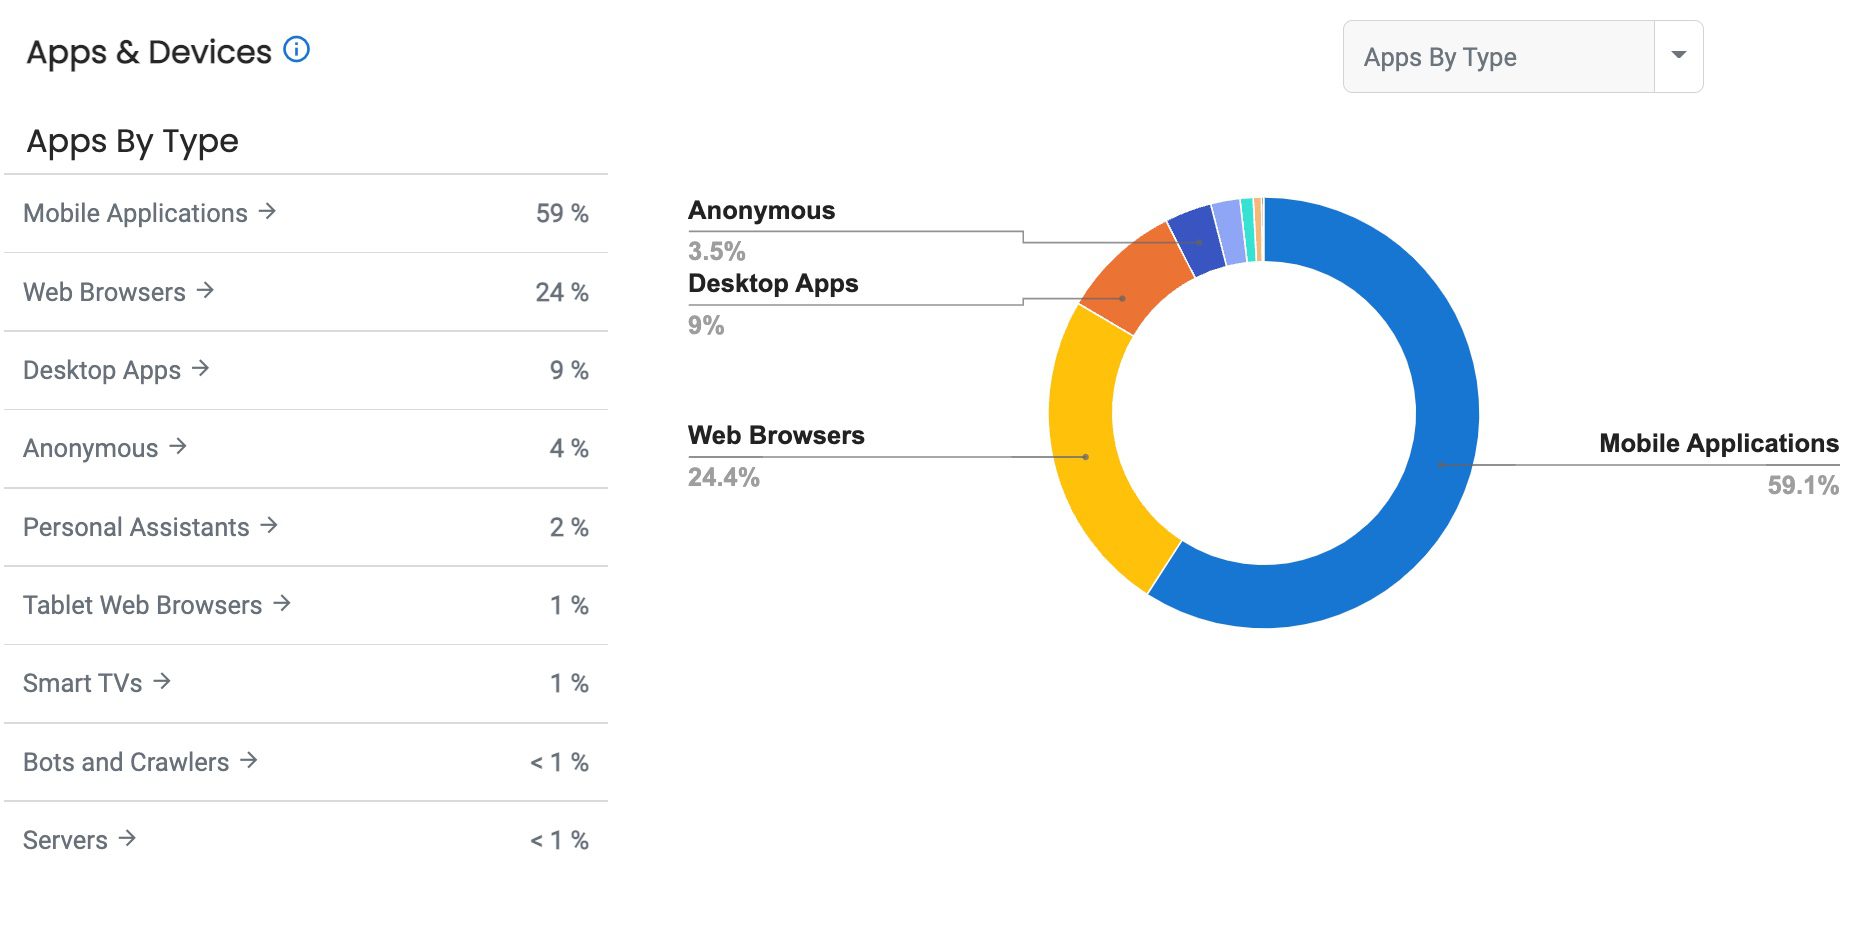
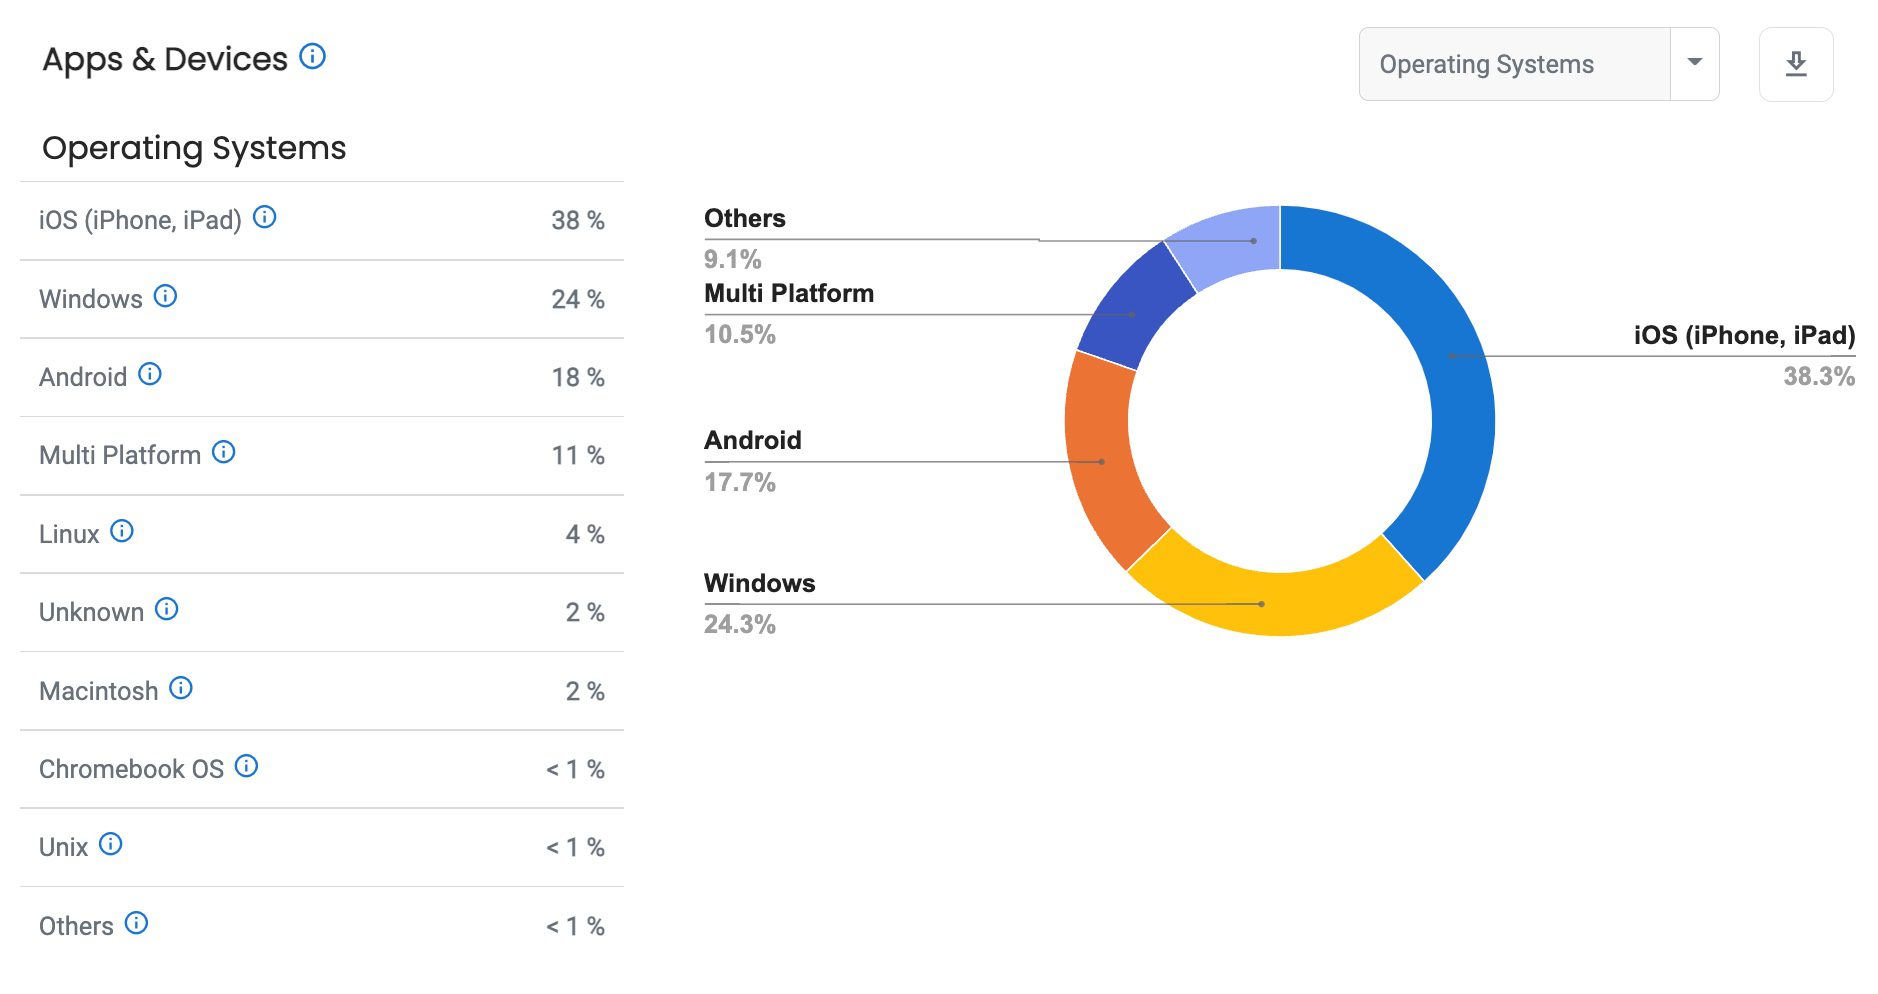
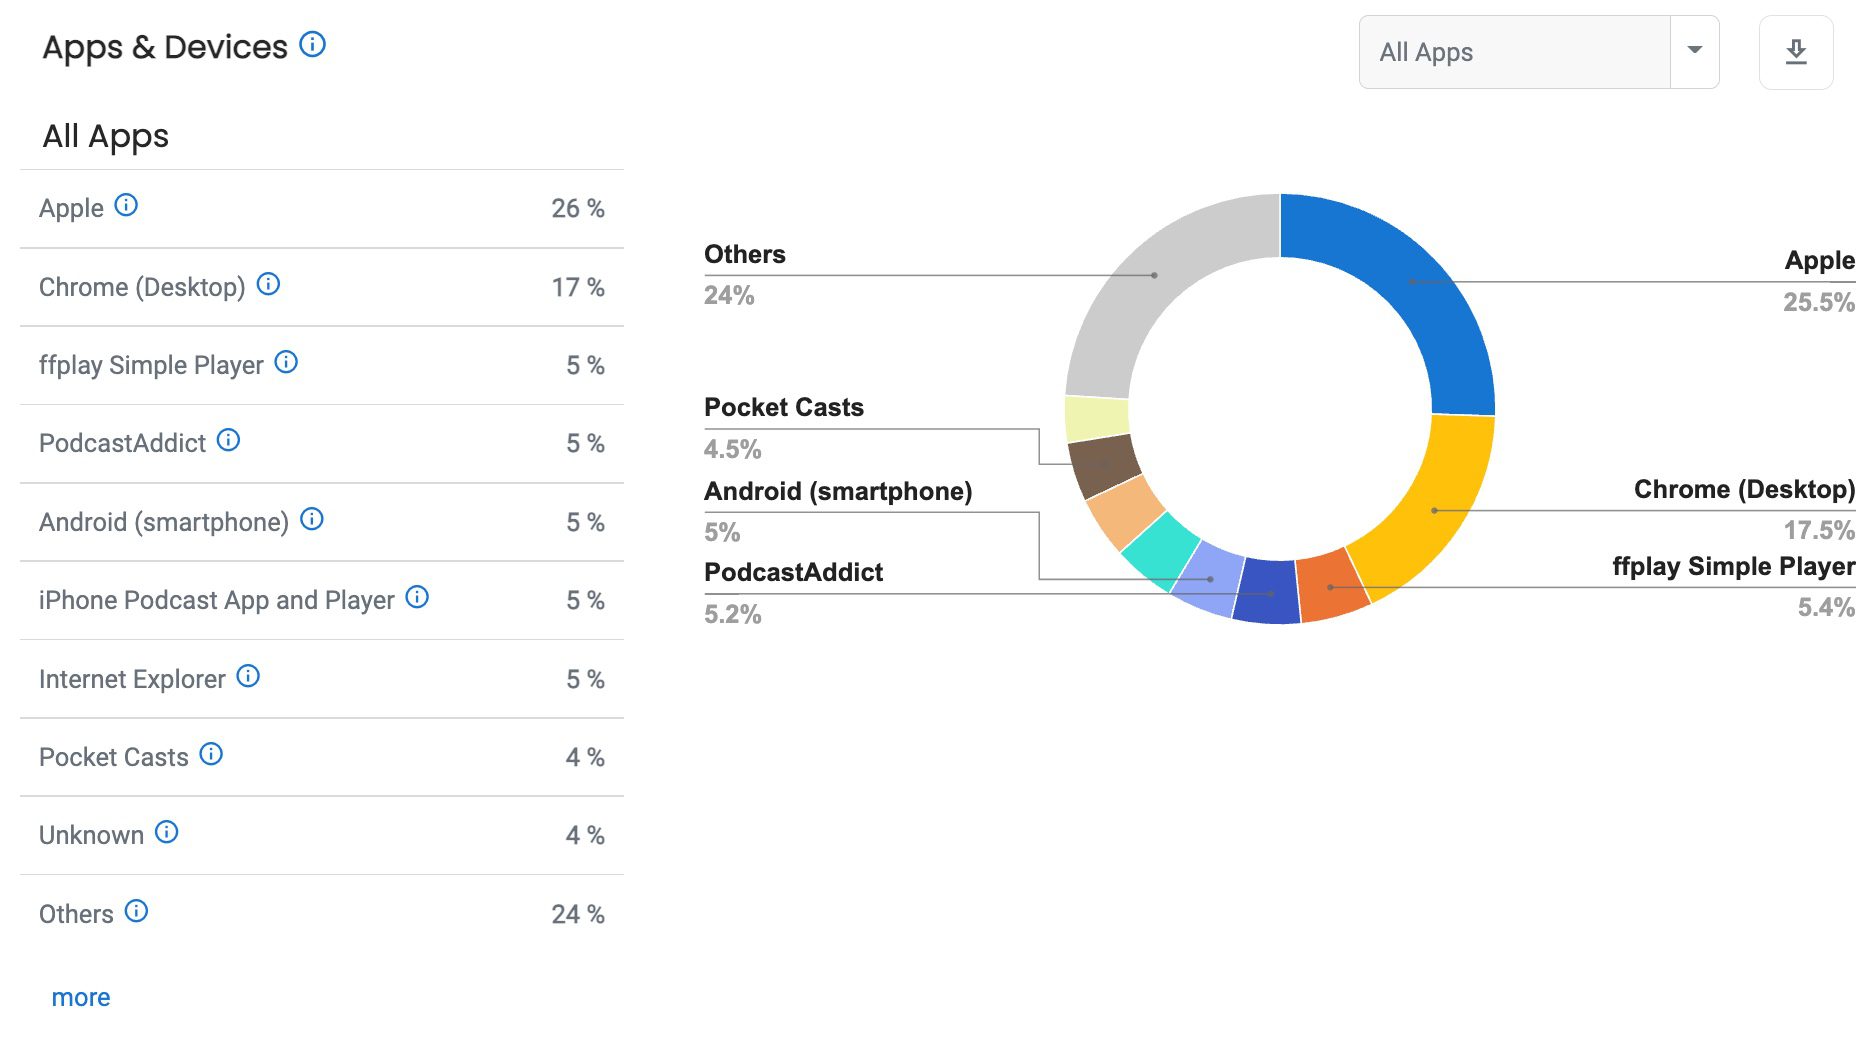
Apps and Devices details how people listen – for example, Apple iOS or a Firefox browser, iPhone or Android – or whether your listeners stream your podcast on Alexa or Apple Home Pod.
“It’s enlightening to see the retention information…this will be helpful in designing my show content to engage the listener through to the end! I especially like that it’s available at the episode level….I can share this information with my advertisers to show their ads are being listened to. It will also help me see which types of content and length of episode get the most engagement….LOVE THIS FEATURE!!”
— Maureen Usuna
Get a free trial of Blubrry Podcast Statistics or sign up for free Podcast Hosting migration; and we provide all the support you need via phone, email or web conference call to make sure you’re on track.
We want to thank UI/UX designers Krissie and Aaron for putting countless hours into the design and the entire development team in making their vision become reality.


