As any content creator knows, understanding your audience is key to success – and for podcasters, that includes having a good sense of where listeners are tuning in. Armed with solid information about which applications and platforms consumers are using at the highest rates, podcasters can make necessary decisions about where to invest time, energy, money and other resources.
To help our customers better understand their audience, RawVoice / Blubrry is sharing that information with the tens of thousands of podcasters who use our services, and the podcasting community as a whole. Following is a breakdown of global statistics data from April 2016, constituting a sampling of over 40,000 shows and over 100 million listener downloads and on-demand podcast plays. We’ve been collecting, analyzing and studying podcast statistics data since 2006, and recently have seen fairly rapid changes in this ever-evolving space. Some of the data you’re about to read may surprise you.
How Podcasts Are Being Consumed:
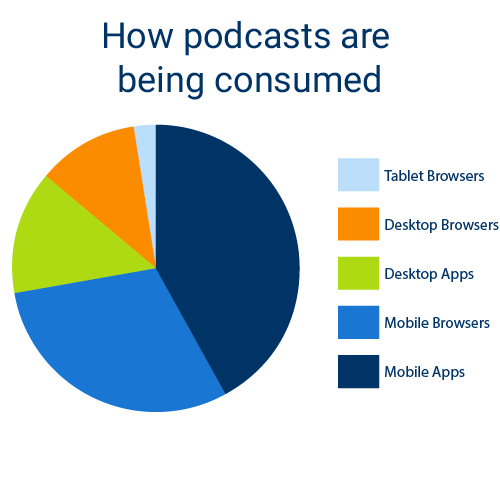
- Mobile Applications 42.00%
- Mobile Web Browsers 30.30% (may include some mobile apps that do not specify their own user agent)
- Desktop Applications 13.90%
- Desktop Web Browsers 11.30%
- Tablet / Pad Web Browsers 2.50%
The Takeaway: While it’s not surprising that mobile apps are the most popular stand-alone method of podcast consumption, don’t miss the fact that tablet browsers, mobile web browsers, and desktop web browsers combined make up a potentially even higher portion of listens. What that means for podcasters: the audio player you use makes a difference to what potentially could be a big chunk of your audience. (Did you know that Blubrry/PowerPress recently revamped our free audio podcast player?)
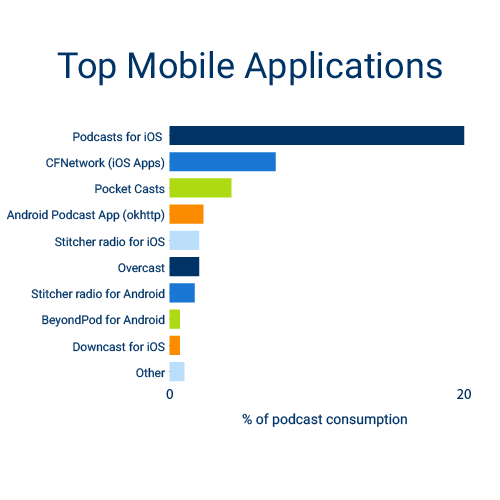
Mobile Applications – 42% Overall
 Note: The data points below only highlights the top 30 clients with 100+ clients referred to in any category as other..
- Podcasts for iOS – 20.2%
- CFNetwork (iOS Apps) – 7.2%
- Pocket Casts – 4.2%
- Android Podcast App (okhttp) – 2.3%
- Stitcher radio for iOS – 2.0%
- Overcast – 2.0%
- Stitcher radio for Android – 1.7%
- BeyondPod for Android – 0.7%
- Downcast for iOS – 0.7%
- Other – 1.0%
The Takeaway: While Podcasts for iOS still reigns, all those other mobile apps add up to an even-bigger chunk of listeners. Don’t ignore Android apps, and pay particular attention to up-and-coming apps with loyal followings, like PocketCasts and Overcast. Sadly though, since Stitcher was acquired, it has lost 3-4% of global market share according to our data.
Client Breakdown:
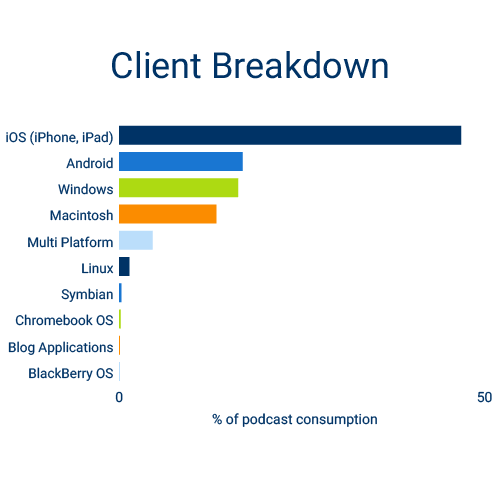
- iOS (iPhone, iPad) – 46.8%
- Android – 16.9%
- Windows – 16.3% (Includes 5.9% iTunes Desktop)
- Macintosh – 13.3%
- Multi Platform – 4.6%
- Linux – 1.4%
- Symbian -0.3%
- Chromebook OS – 0.2%
- Blog Applications – 0.1%
- BlackBerry OS – 0.1%
Clients By Platform:
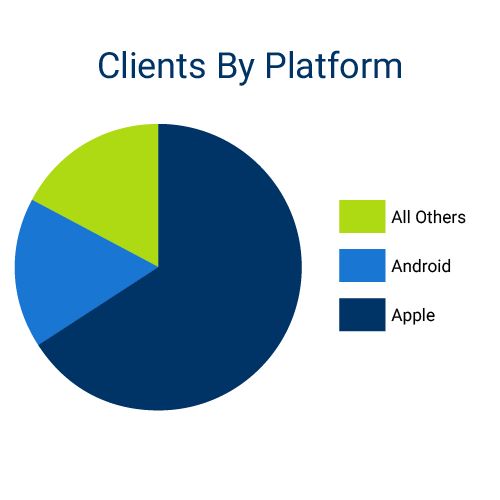 Apple Ecosphere – 65.9%
- Podcasts for iOS -20.20%
- iPhone Browser Media Player – 17.50%
- iTunes Desktop Applications (Mac/Win) – 11.60%
- CFNetwork (iOS Apps) – 7.20%
- Pocket Casts (IOS Apps) – 2.20%
- iPad Browser Media Player – 2.30%
- Stitcher radio for iOS -2.0%
- Overcast (IOS Apps) -2.0%
- Downcast (iOS Apps) – .7%
- Other – .2%
Android Ecosphere – 16.9%
- Android (smartphone) – 7.80%
- Pocket Casts – 2.0%
- Android Podcast App (okhttp) – 2.30%
- Stitcher radio for Android – 1.70%
- Samsung with Android – 1.10%
- BeyondPod for Android – 0.70%
- DoggCatcher – .20%
- AntennaPod – .20%
- Player FM for Android – .20%
- Other .7%
The Takeaway: While global listener volume is continuing to increase across all platforms, it is very apparent to our month to month, year to year data that Android is making significant gains in the global podcast ecosphere. For the first time in many years we are seeing a significant increase in Android consumption, specifically, applications that support Blubrry’s one-click Subscribe on Android that are now breaking out in the top 30 used.
Below is an even more detailed breakout of individual applications, browsers and platforms:
Mobile Web Browsers – 30.3%
- iPhone Browser Media Player – 17.5%
- Android (smartphone) – 7.8%
- Chrome (Mobile) – 3.2%
- Samsung Android – 1.1%
- Other – 0.70%
Desktop Applications – 13.9%
- iTunes – 11.6%
- Windows Media Player – 1.6%
- Other – 0.7%
Desktop Web Browsers – 11.3%
- Chrome (Desktop) – 5.5%
- Internet Explorer – 2.6%
- Firefox – 2.1%
- Safari (Desktop) – 0.5%
- Other – 0.6%
Tablet / Pad Web Browsers – 2.5%
- iPad Browser Media Player – 2.3%
- Other – .20%
Note:
The averages above are calculated from our filtered totals that appear in our client’s individual podcast statistics dashboards.
These totals do not include our enterprise clients like ESPN or ABC, nor do they include media buyers that utilize our enterprise solutions for measuring their podcast advertising campaigns.
There are over 100 additional applications and clients that are not included in this list, as they have less than 1 percent of global market share.
News, media agencies, podcasters, and bloggers are welcome to quote this information so long as full attribution to Blubrry/RawVoice, with a hyperlink to this article, is provided.